- Basic Weather and Water Info
The purpose of Jim's Kayaking Weather Forecast web page is to display the weather forecast
and water condition forecast on the same web page. This web page pulls resources from several different
government datasources for much of its data. It does some calculations on its own to forecast some of the data shown.
It also shows historical data gathered from the government web sites.
In the end, it draws what is hopefully an accurate picture for the data.
All data is updated once per hour unless otherwise noted. Refer to the sections below for more details about how the data is pulled
together to form the complete picture. The image shown is for a complete day starting and ending at midnight.
DISCLAIMER: It's a forecast. Do not rely on the web page to be accurate at all for the forecasted information.
For the historical data, please refer to the web links provided.
- Sunrise and Sunset
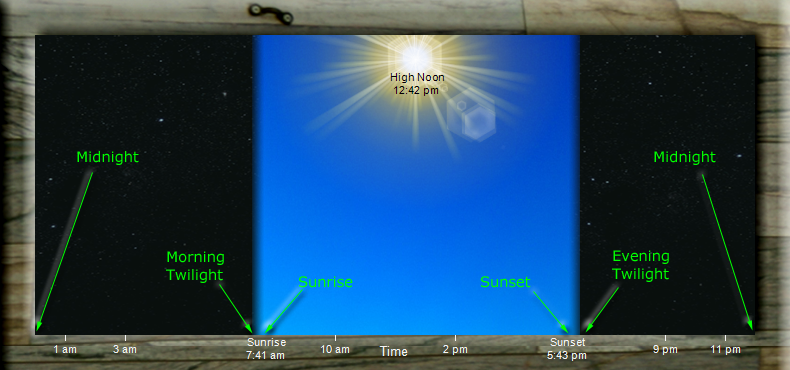
This first part to generating the weather image is to calculate the sunrise, sunset, and twilight times.
The sunrise and sunset times are calculated using some incredibally complex equations. I can't even begin to explain them
so I will refer you to a U.S. Navy web page for some better info.
On this web site is a link to sunup.bas which is where I found code to translate to .Net source code. This
code comes from Sky and Telescope which of course would have some good info.
For those interested in details, the twilight times are calculated using civil twilight rather than nautical twilight.
After these times are calculated, the basic image can be drawn as shown below.
- Moonrise and Moonset
Like the sunrise and sunset times, these too are very complicated calculated values far beyond my comprehension.
So, also given on the U.S. Navy web page is a link
to moonup.bas which is where I found code to translate to .Net source code. This code also comes from
Sky and Telescope.
The moon rise and moon set times are shown at the top of the image.
After adding these times, the image will look similar to the one shown below.
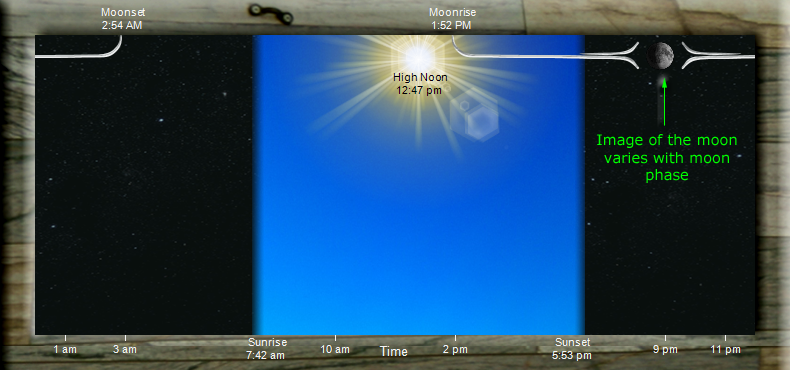
Note that the image of the moon will vary each day as the moon progresses through its phases (moon age).
In this case shown above, the moon will rise during the afternoon although you cannot see it,
and it will set early in the morning the following day.
Observing the moon and comparing to this web site to Naval data
shows that the calculations appear to be correct.
- National Weather Service and NOAA
From the National Weather Service, we retrieve the FORECAST
information for the air temperature, chance of precipitation, anticipated amount of precipitation, cloud cover, relative humidity,
and any hazard conditions such as tornados and lightning.
Data is pulled from the National Weather Service on an hourly basis.
The National Weather Service provides a detailed forecast only for the next 7 days.
From NOAAs National Climatic Data Center,
we retrieve HISTORICAL information for the actual
amount of precipitation for the Columbus area and for several sites upstream from Columbus. The actual precipitation amounts
from upstream sites are used in the water flow forecast. In particular, 3 NOAA sites in the Columbus area are used
to provide an average precipitation in Columbus on a daily basis.
3 sites in the West Point area; 4 sites in the Whitesburg area; 5 sites in the Atlanta area, and 4 sites in the Buford area
are all used in forecasting the water flow in Columbus. However, this data is not retrieved on an hourly basis because this web service
is a bit finicky about software hitting its site too frequently.
Forecast data other than the precipitation (temperature, cloud cover, etc) becomes historical data as time passes by.
Thus, this information is assumed to be correct as we pass through each hour.
However, because data is retrieved on an hourly basis, we can presume that the National Weather Service
is very accurate on it's forecast within the next few hours.
Air Temperature
A sample image that displays the air temperature is shown below. The temperature scale (degrees F) is shown on the left of the image.
This image shows the temperature warming up during the daytime and cooling at night. The small bumps in the forecast data are likely due to
varing amounts of cloud cover and/or a front moving through.

Precipitation
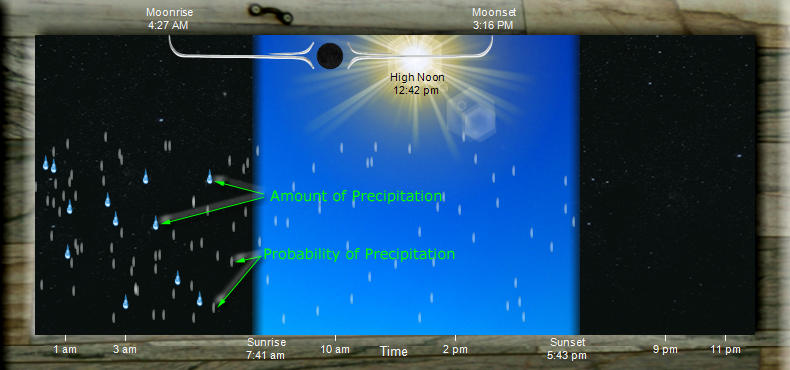
The image below is a sample that displays the chance of precipitation and amount of precipitation.
The probability of precipitation is shown by the small slither of a raindrop.
Each slither represents a 10% chance of precipitation within the 1 hour time frame that it is in.
The actual amount of precipitation is shown as a raindrop.
If the forecast predicts snow or hail then appropriate icons are drawn.
Each raindrop represents 1/100th of an inch of rain.
Thus the sample below shows a little more that 1/10th of an inch of rain in the morning hours.
Cloud Cover
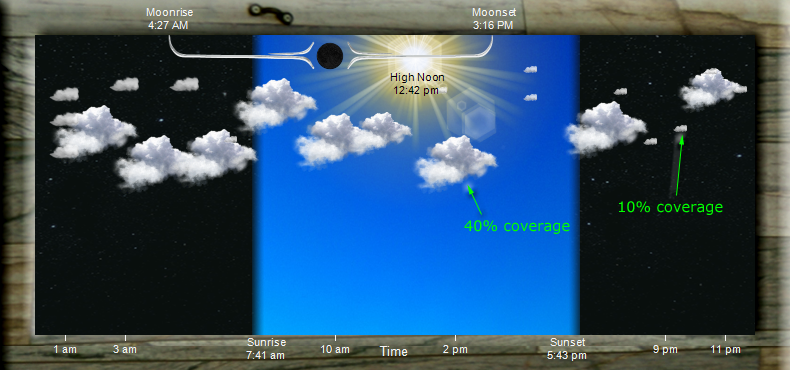
A sample image that shows the cloud cover is provided below. Each small cloud represents a 10% cloud coverage within the hour
that the cloud is drawn. Larger clouds represent a greater cloud coverage. In the sample below, 2pm has a 40% cloud coverage.
Looking at the 9am hour, there are 2 clouds in it each representing a 40% cloud coverage. Thus the cloud coverage during that hour is 80%.
The hours from 1am to 5am have multiple clouds that represent a 60% cloud coverage.
The clouds that are drawn coincide with the precipitation. Darker rain clouds are drawn on days with a probability of precipitation.
Hazards
The following hazards conditions are displayed: Lightning, Tornadoes, and Fog. If the forecast includes any of these hazards,
then the image is modified to show them.
- U.S. Geological Survey
From the USGS,
we retrieve historical daily water flow rates (discharge)
at Columbus and at 4 upstream sites (West Point, Whitesburg, Atlanta and Buford). These are averaged daily discharge rates (CFS).
The upstream sites are used to forecast the daily water flow rate in Columbus. In the link provided, the Columbus site is "02341505".
For the Columbus site only, we also retrieve the water flow rate and temperature on
an hourly basis.
This data is HISTORICAL and is shown in the weather image.
You can also visit USGS for CMUG1 for more information.
Water Flow Rate
The sample image shown below displays the water flow rate in Cubic Feet per Second (CFS).
Note that there is no scale for the water discharge. The image of the kayak and associated text should be used for the scale.

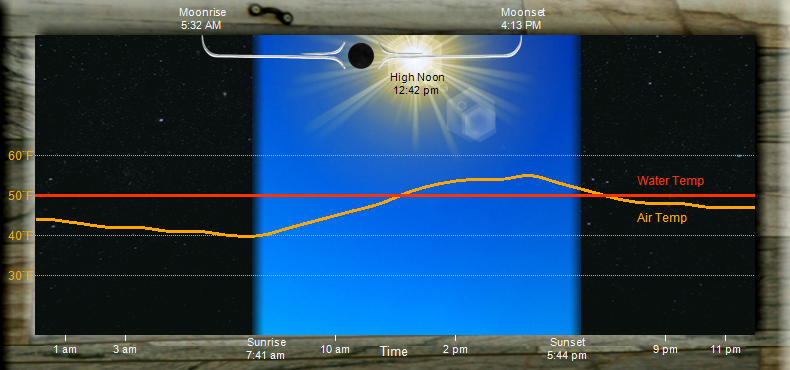
Water Temperature
The sample image shown below displays the water temperature along side the air temperature. The water temperature uses the same scale
as the air temperature.
The water temperature is retrieved from the USGS on an hourly basis but often does not show much variation.
During the summer, the water temperature may fluctuate by only 2 degrees F.
The forecast for the water temperature is that it will be equal to the most recent recorded value. (Easy huh)
- Water Flow Forecast
The Advanced Hydrologic Prediction Services
does forecast water conditions but not for Columbus GA. This is practically impossible to do especially when
mother nature does not control the discharge. Here in Columbus, Georgia Power controls water releases at the dams. You can call
Georgia Powers release schedule telephone at (706) 317-6000 but it is a recording that is good only for the current day.
So I wrote my own water flow rate forecast software. It consist of first predicting a daily water flow and then
using this in an hourly flow rate.
Daily Water Flow Rate Calculation
My forecast begins by predicting a daily water flow rate. This is an average value for all hours during the day.
When predicting a forecast, you can use any mathematical equation that you want no matter how simple, or silly, or crazy, or educated.
No model will be 100% accurate but an educated guess may serve better most. My educated guess includes upstream water conditions,
ground water release, and daily precipitation.
The equation for my model is shown below where the value i represents the day in question and the coefficients c
are computed constants.
 |
Forecast water release value for day i. |
 |
Upstream water release from the previous day. Looking at peaks in the water flow from actual data,
it appears to show that water released from the West Point dam makes it to Columbus 1 day later. |
 |
Typical ground water release. This value is a constant and is heavily dependent
on the drainage area of the water basin. |
 |
Surface water runnoft (oh Brother). This is run-off based on precipitation from day i. |
 |
This is also a surface water run-off term but it is based on precipitation from the previous day. |
 |
This term is based on precipitation from 2 and 3 days prior to the day is question. |
 |
Similar to the above term only based on days 4 to 6 days prior to the day in question. |
 |
And similarly, this term is based on the sum of 7 days precipitation a week prior to the day in question.
This term reflects how rain from the previous week effects ground water release. |
 |
This is a ground water release term that is influenced by 3 weeks of precipitation
beginning at 14 days prior to the day in question at looking back.
This part of the equation covers precipitation 35 days in the past.
|
Thus the equation above covers precipitation from the current day all the way back to 35 days in the past.
It also includes upstream release values and a constant ground water release. All components in the equation are linear.
So, using a least-squares-fit analytical procedure
on recorded data will yield the six c coefficients and G. 4 years of previous daily data were used in the LSF analysis.
These coefficients are determined for Columbus 02341505 and four upstream sites
(Buford - 02334430, Atlanta - 02336490, Whitesburg - 02338000, and West Point - 02339500).
Next, given the coefficients, the water release for any day in the future can be forecast by using:
- the actual precipitation retrieved from the NCDC,
- the forecast precipitation retrieved from the NWS,
- the upstream water release retrieved from the USGS or determined from this equation.
So, starting at Buford, I calculate a 2 week water release forecast. Although the precipitation
forecast that I use is that for Columbus, I do not expect it to differ much from Columbus.
After all, how accurate are weather forecast? Then I calculate water release in Atlanta which will use
a calculated Buford water release. Whitesburg is calculated next, followed by West Point and finally Columbus.
Hourly Water Flow Rate Calculation
But we want an hourly water flow rate to know when water will be released and how much.
This is achieved by using previously recorded hourly water flow rates (actual data from the USGS) to generate a normalized curve
for each hour during the day. Only hourly data from the previous 2 months is used. Hopefully this will account for any seasonal tendancies
that Georgia Power has for water release. Georgia Power has typical times during the day that they will change the water flow rate. Thus,
this approach is perfectly viable for a forecast. Also, the data is separated by the day of the week. I expect the water release schedule
on a Saturday to be different from that on a Tuesday.
So for the forecast day, the daily water flow rate is simply multiplied by the normalized hourly curve.
|